IoT: Dashboard and Reporting Tools to Visualise Data

In the era of Internet of Things (IoT) devices, the world around us is becoming more interconnected, smarter, and data-driven.
IoT devices are constantly generating an unprecedented amount of valuable raw data. This raw data can be converted into usable and easy-to-interpret information that can revolutionise decision-making, enhance efficiency, and optimise processes across industries.
To take advantage of the full potential of this data, dashboards and data visualisation play a pivotal role. In this article, we will explore how dashboards and data visualisation from IoT devices empower businesses and individuals to gain deeper insights and make informed decisions.
1. UNDERSTANDING DATA GENERATION BY IOT DEVICES
An IoT device is a physical piece of hardware that comes with embedded electronics, sensors, software, and communication capabilities that enable it to collect, exchange, and process a ton of real-time data.
You might not know it, but these devices are much more common than you think, and they’re based in locations such as homes, industrial sites, healthcare facilities, and pretty much everywhere else where there is some form of technology.
These devices can track and measure things like temperature, pressure, motion, energy consumption, humidity, and much more, depending on the application and its desired functions.
Picture this, the IoT device is located in a location, and it goes about doing its job of measuring whatever it’s set out to measure. Not only is it measuring this data on an ongoing basis, but it’s also continuously streaming (sending) this data to a central cloud-based location where all the IoT device data is securely stored.
2. VISUALISING IOT DATA TO EMPOWER USERS
The data that is continuously transmitted from these IoT devices is typically stored in a central, secure database. Over time, the volume of information grows and grows, forming a goldmine of information that can be converted into a visual format.
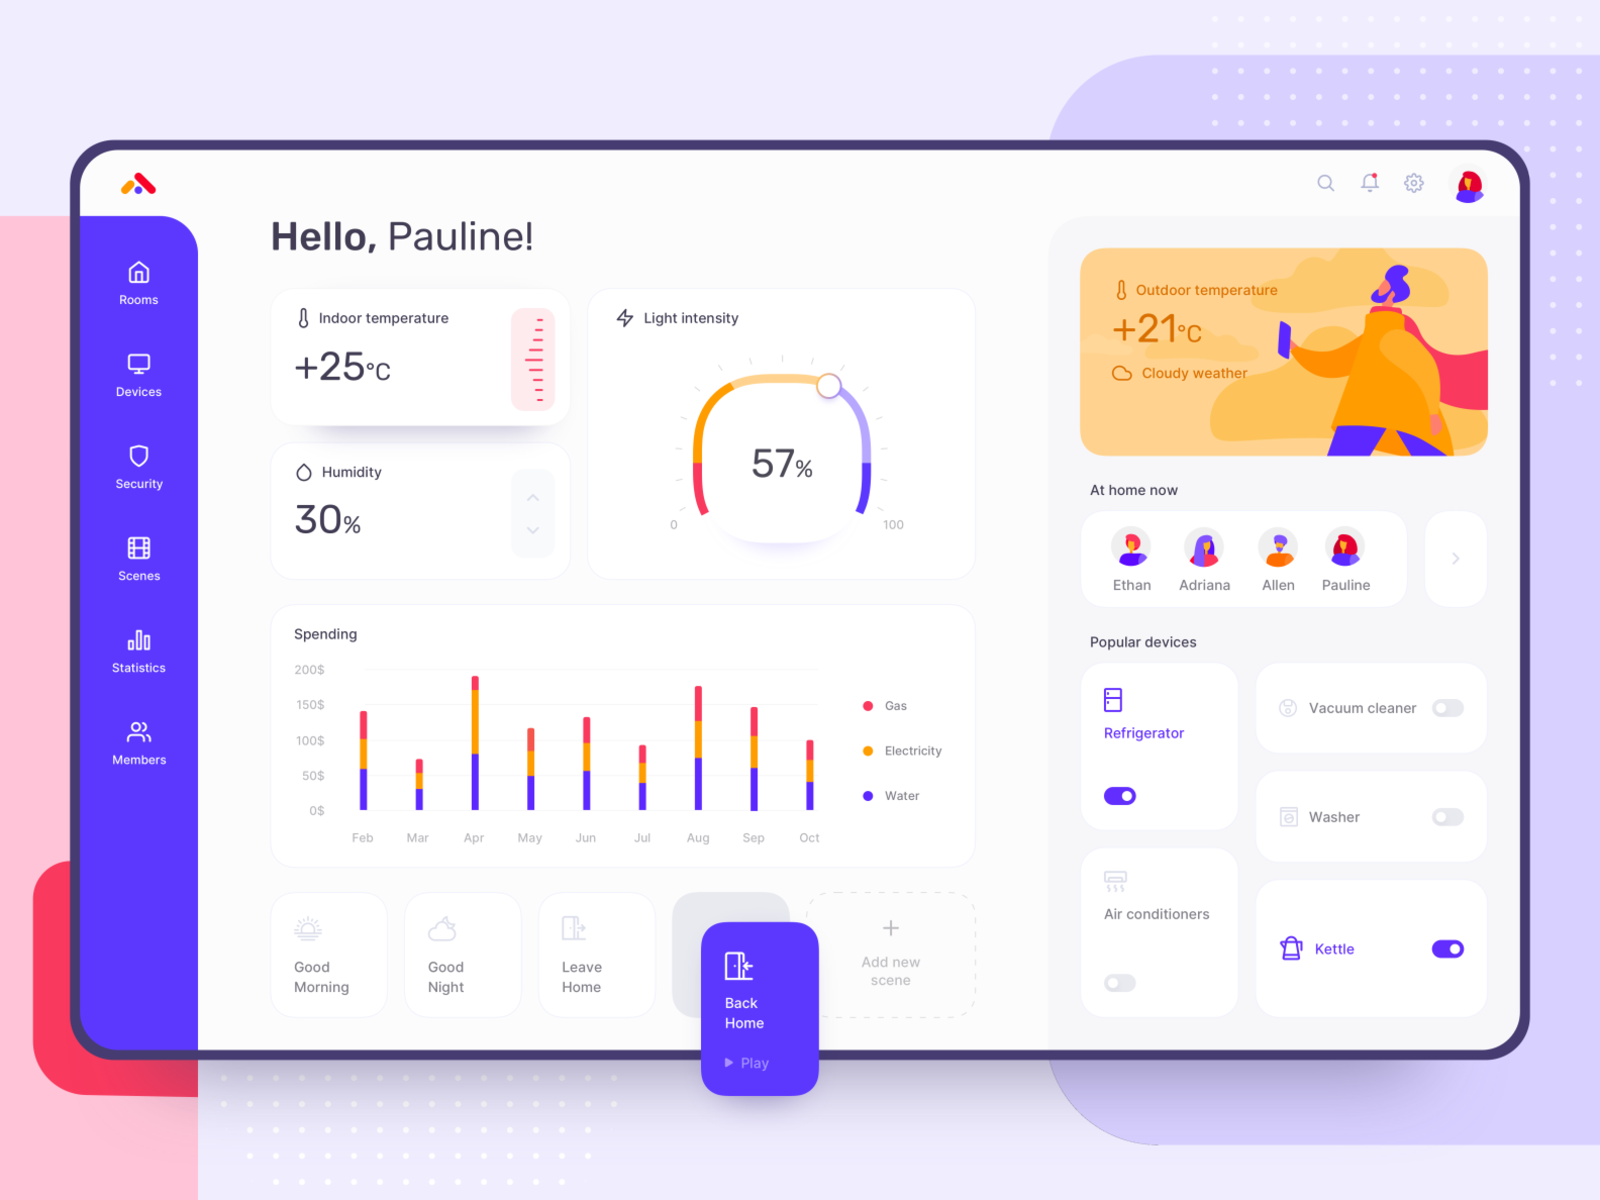
The data visualisation is typically done by converting the raw data into interactive dashboards, graphs, charts, and reporting tools.
As humans, we can interpret things much better visually as opposed to looking at rows and rows of numerical data, which is why data visualisation is so powerful.
By developing custom dashboards within web apps, data can be visualised to unveil trends, patterns, and correlations that were previously not available.
These powerful tools enable organisations to optimise processes, predict maintenance needs, and deliver better services to end-users.
THE NEED FOR DASHBOARDS TO INTERPRET IOT DEVICE DATA
Dashboards are nothing new, and they’ve been used in many industries for decades for good reason.
Dashboards are typically accessed through a central web-based platform; they are great for aggregating, analysing, and visualising the data that’s been received from multiple IoT devices in the field.
These user-friendly interfaces provide a real-time overview of critical metrics and allow users to monitor and control connected devices efficiently.
We’ve mentioned how IoT devices generate an enormous volume of data, and with that being said, dashboards help aggregate and consolidate this information in a structured and accessible format. Users can easily navigate through different data sets and filter information based on specific criteria.
By incorporating dashboards and other visual reporting tools into secure web applications, we’re able to facilitate data visualisation.
Data visualisation is the art of representing complex data sets through charts, graphs, maps, and other visual elements. In the context of IoT data, visualisation transforms raw numbers into meaningful insights that are easy to comprehend and act upon.
Interactive data visualisations allow users to not only understand complex data in an easy-to-interpret format but also to zoom in on specific time frames, drill down into specific data points, and interactively dissect the data from different angles.

OUR CUSTOM DEVELOPED IOT DASHBOARDS
At Elemental, we understand how important data visualisation is in understanding and using IoT devices to their true potential. We take pride in our expertise in designing and developing custom dashboards that cater to our clients' specific needs and the diverse data generated by IoT devices.
Every organisation has unique requirements and objectives when it comes to harnessing IoT data. We work with our clients to identify key performance indicators (KPIs) and critical metrics that are most relevant to their operations. Our team ensures that the most critical information is readily accessible at a glance while enabling users to drill down into granular data for deeper analysis.
TO FINISH UP
In the world of IoT devices, an enormous amount of data is generated on an ongoing basis. This data itself is not very useful, but when processed and represented visually through dashboards and other tools, it empowers users to understand patterns, trends, and problems, enabling them to make critical decisions.
By converting raw data into visually appealing formats, we can uncover trends, patterns, and correlations that were previously hidden. These powerful tools enable businesses and individuals to predict maintenance needs, and provide better services to end users, among many other benefits.
At Elemental, our expertise lies in designing and developing custom dashboards tailored to our clients' specific needs and the diverse data generated by IoT devices. If your business needs a trusted and reliable web development company to bring your data to life, it’s time to get in touch!